 English (UK)
  Русский
 How shall I use NodeXL software for the analysis and visualization of an ego-network from the VK.com service?
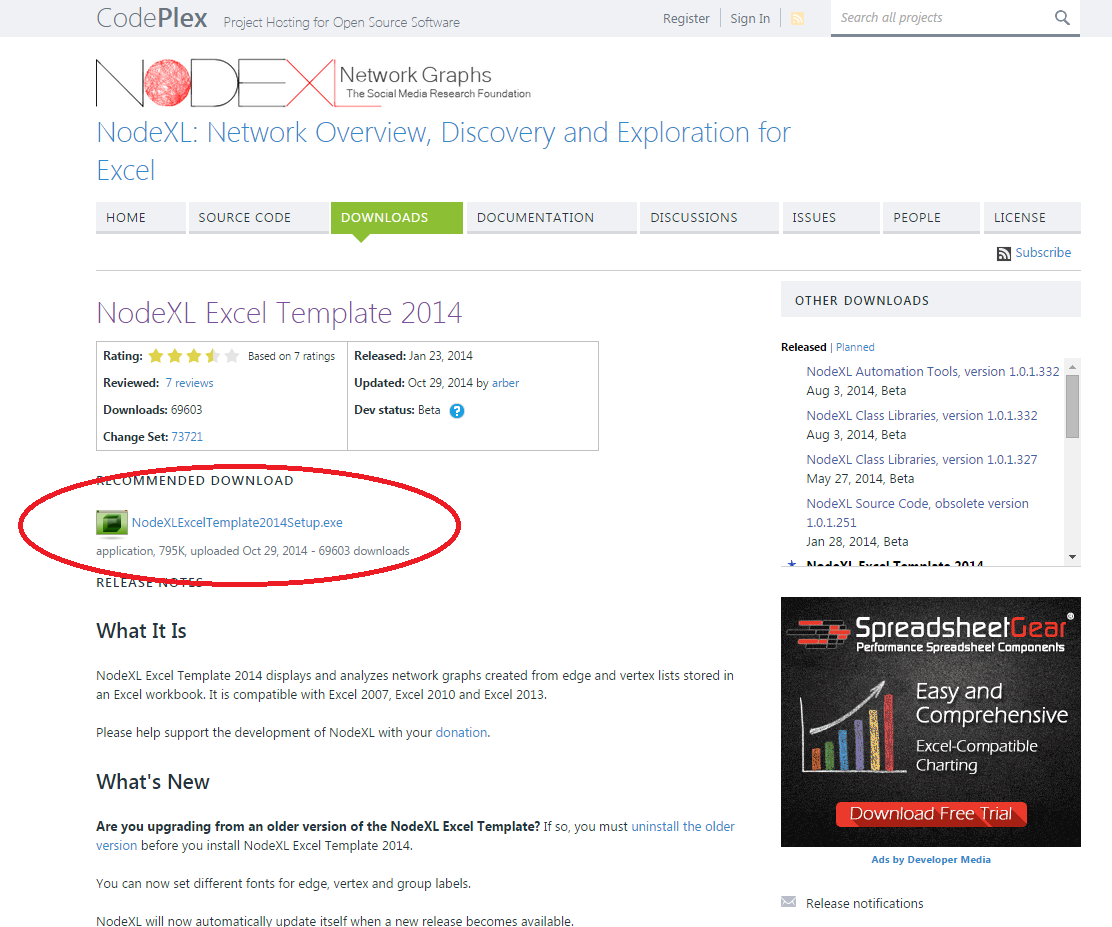
1. Download and install NodeXL Excel Template 2014.
http://nodexl.codeplex.com/releases
The NodeXL Excel Template 2014 software helps to visualize and analyze the network graph created by data from the Excel worksheet with vertices and edges lists.
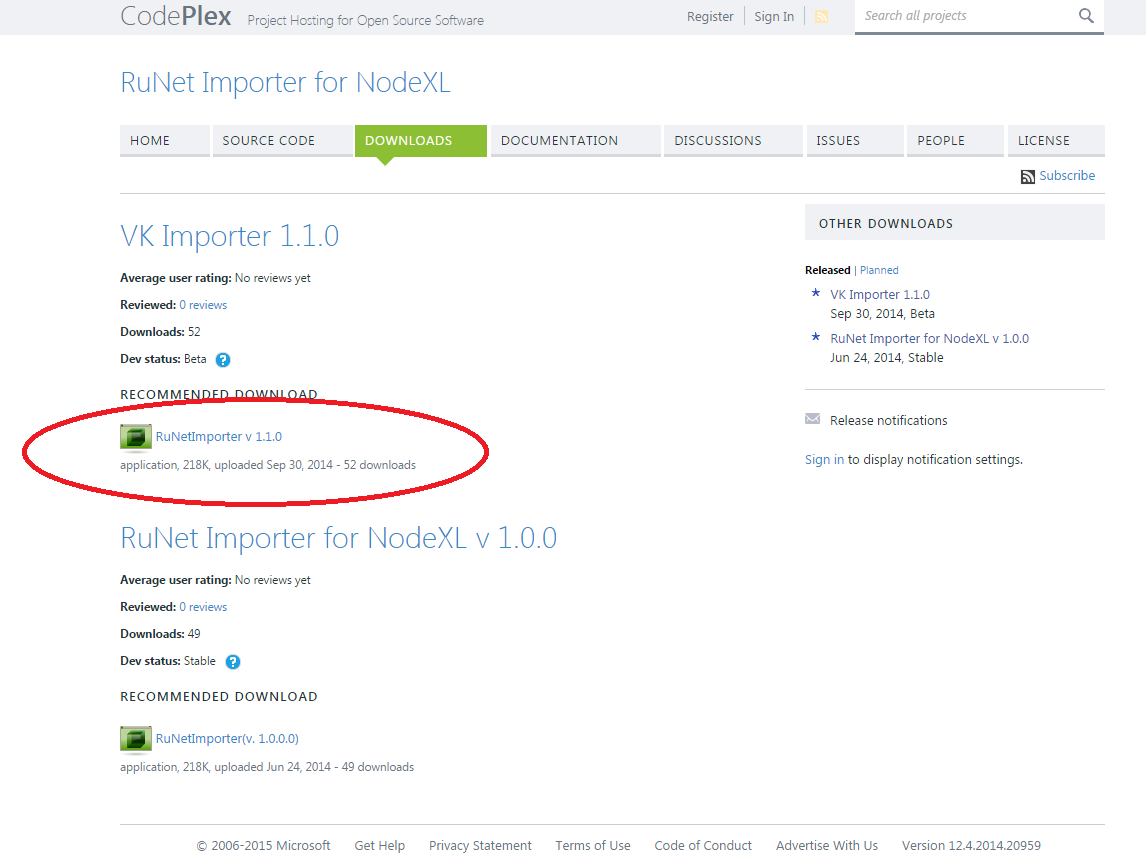
2. You may need the plug-ins to create the lists with vertices and edges for NodeXL. To proceed with the social network analysis of VK.com download zip archive VK Importer 1.1.0: http://runetimporter.codeplex.com/releases/ The archive includes four .dll files. We assume you have it installed in the default location C:\Program Files\Social Media Research Foundation\NodeXL Excel Template. Copy these files to NodeXL plugins directory C:\Program Files\Social Media Research Foundation\NodeXL Excel Template\Plugins. Start or restart NodeXL.
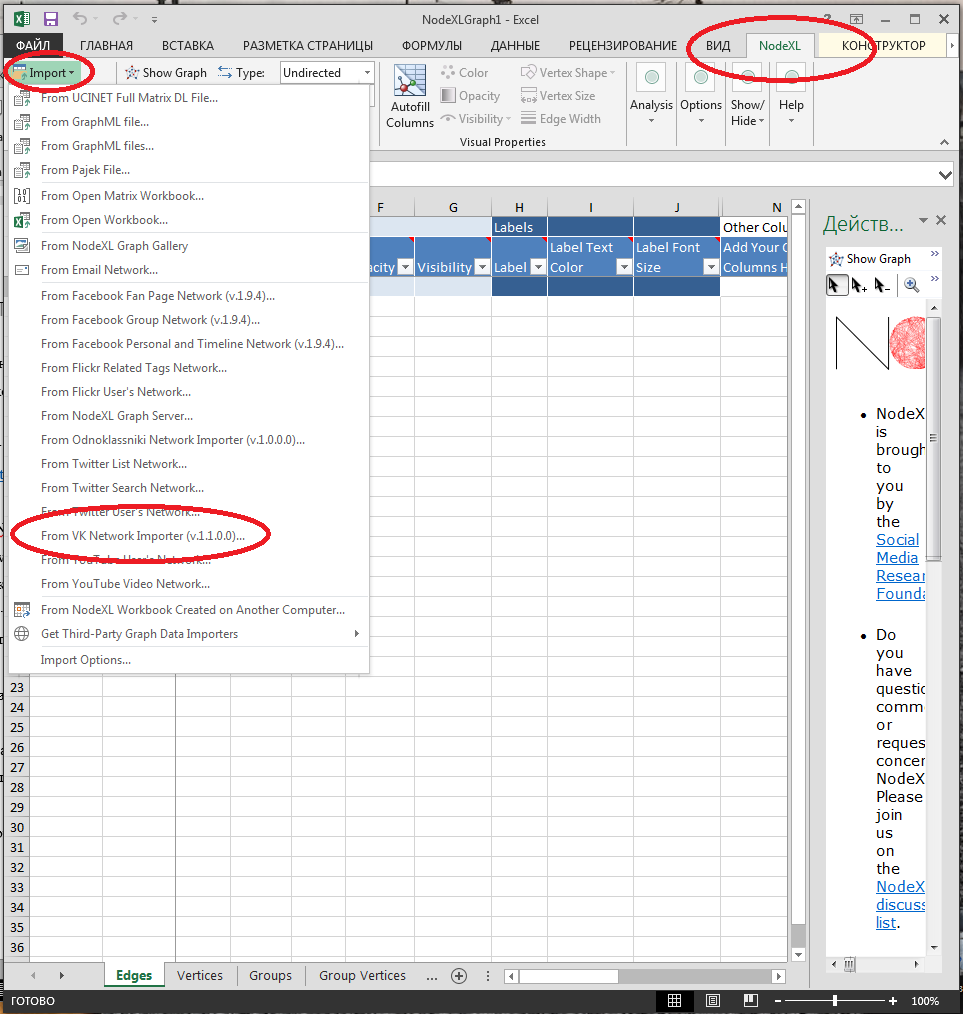
3. Open NodeXL (Windows menu – All programs – NodeXL – NodeXL Excel Template), choose the tab NodeXL – menu Import – menu From Vk Network Importer.
4. Choose Login and create an account in VK.com.
Point all items except Name.
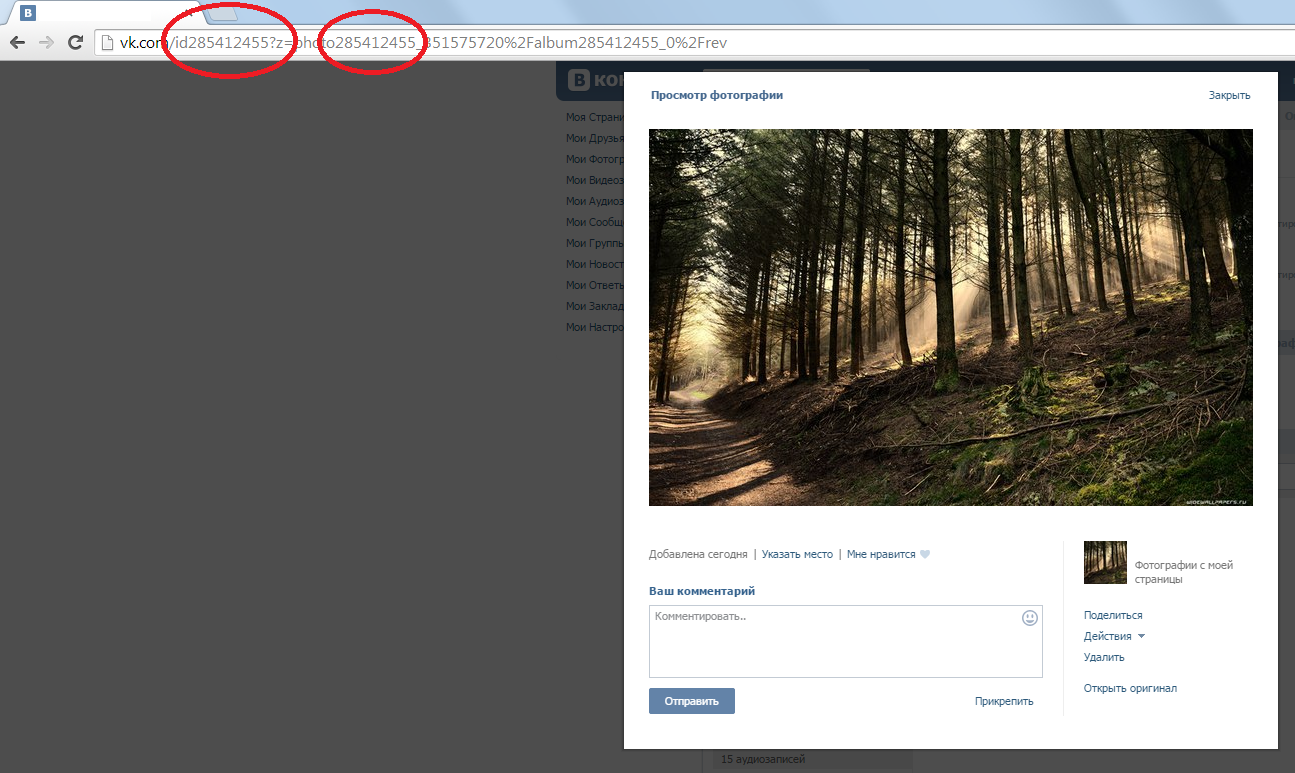
In field Network enter the vk-user ID to start the ego-network visualization and analysis. One may find the user ID in URL address bar and represents a number of numeric symbols. i. e. 1111111 for http://vk.com/id1111111. In case you find a nickname created by a user, his or her ID can be found in the URL address of the profile photo.
Hence clique Download. If you want to include the node of the user to the network, choose the Include ego item.
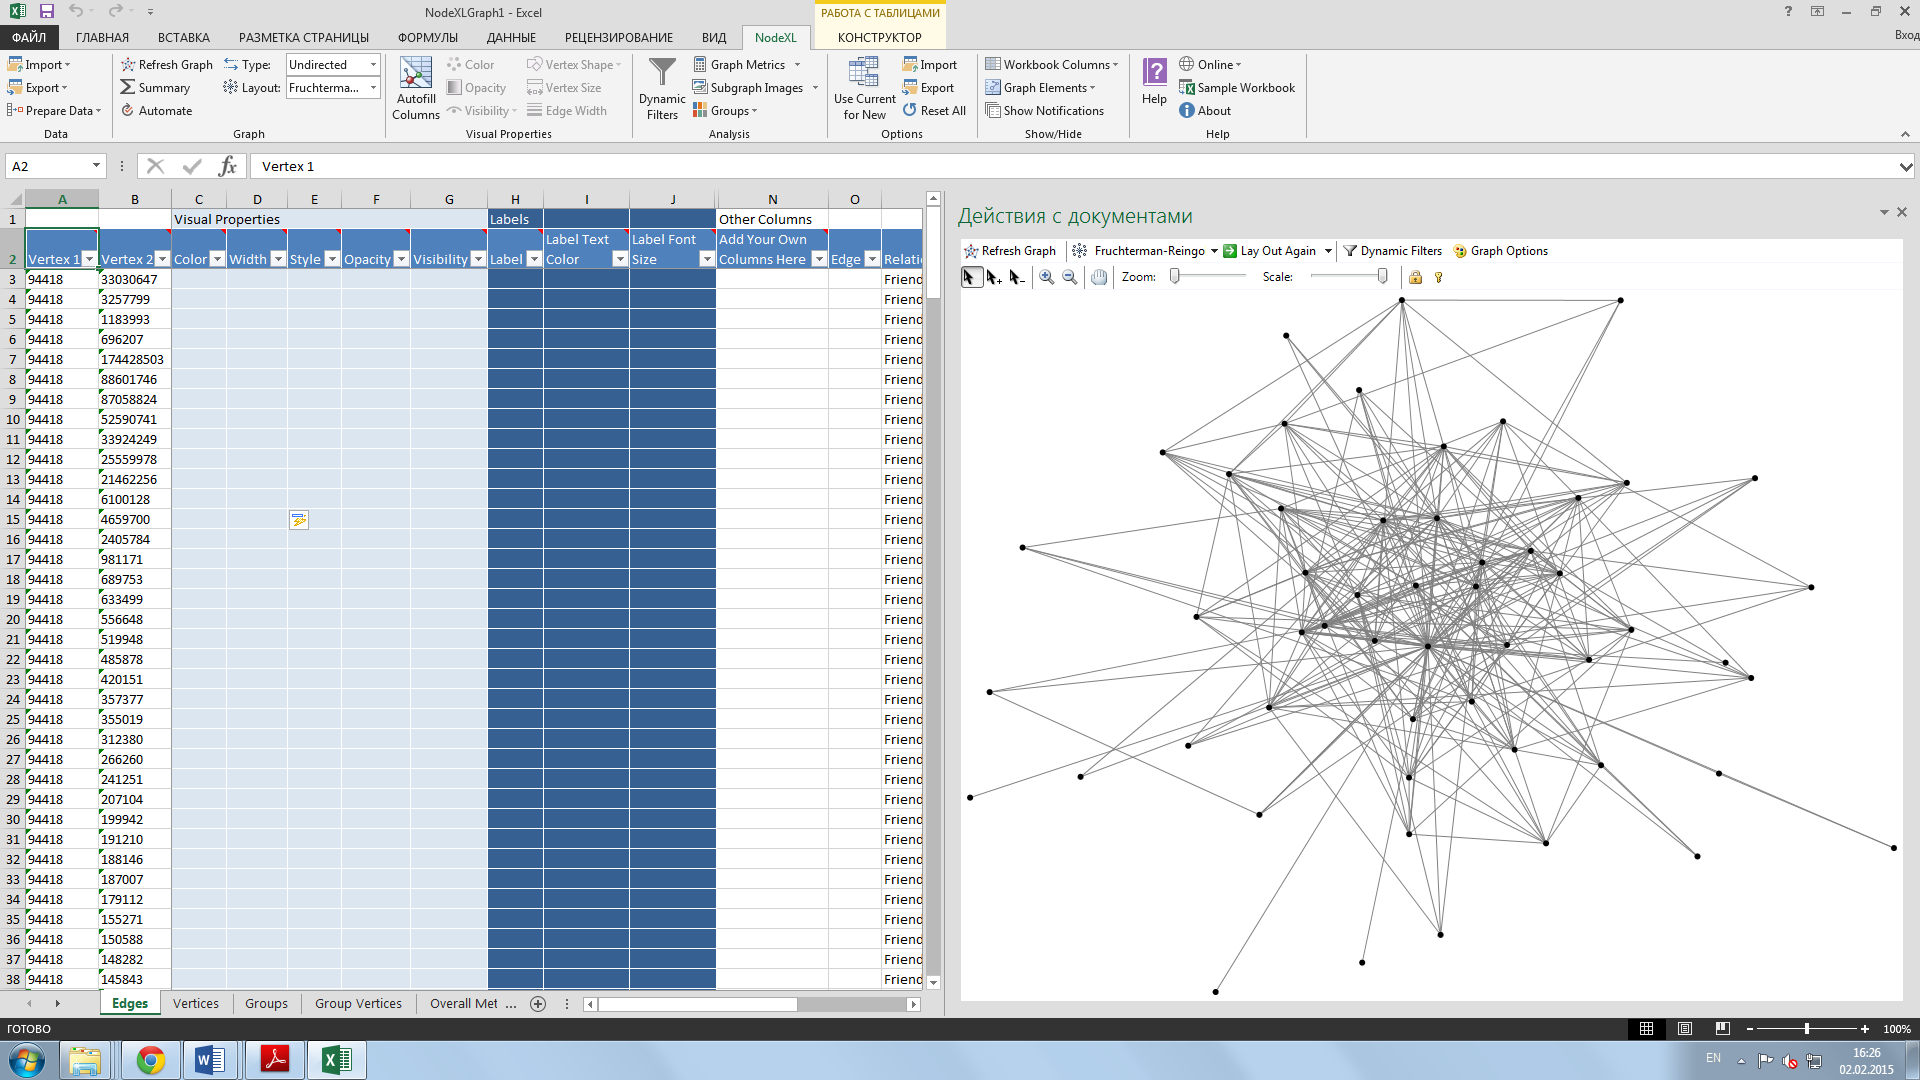
5. Now you proceed with the worksheet with the nodes and edges, in the right field hit Show graph to see the visualized graph.
6. For visually compelling graph:
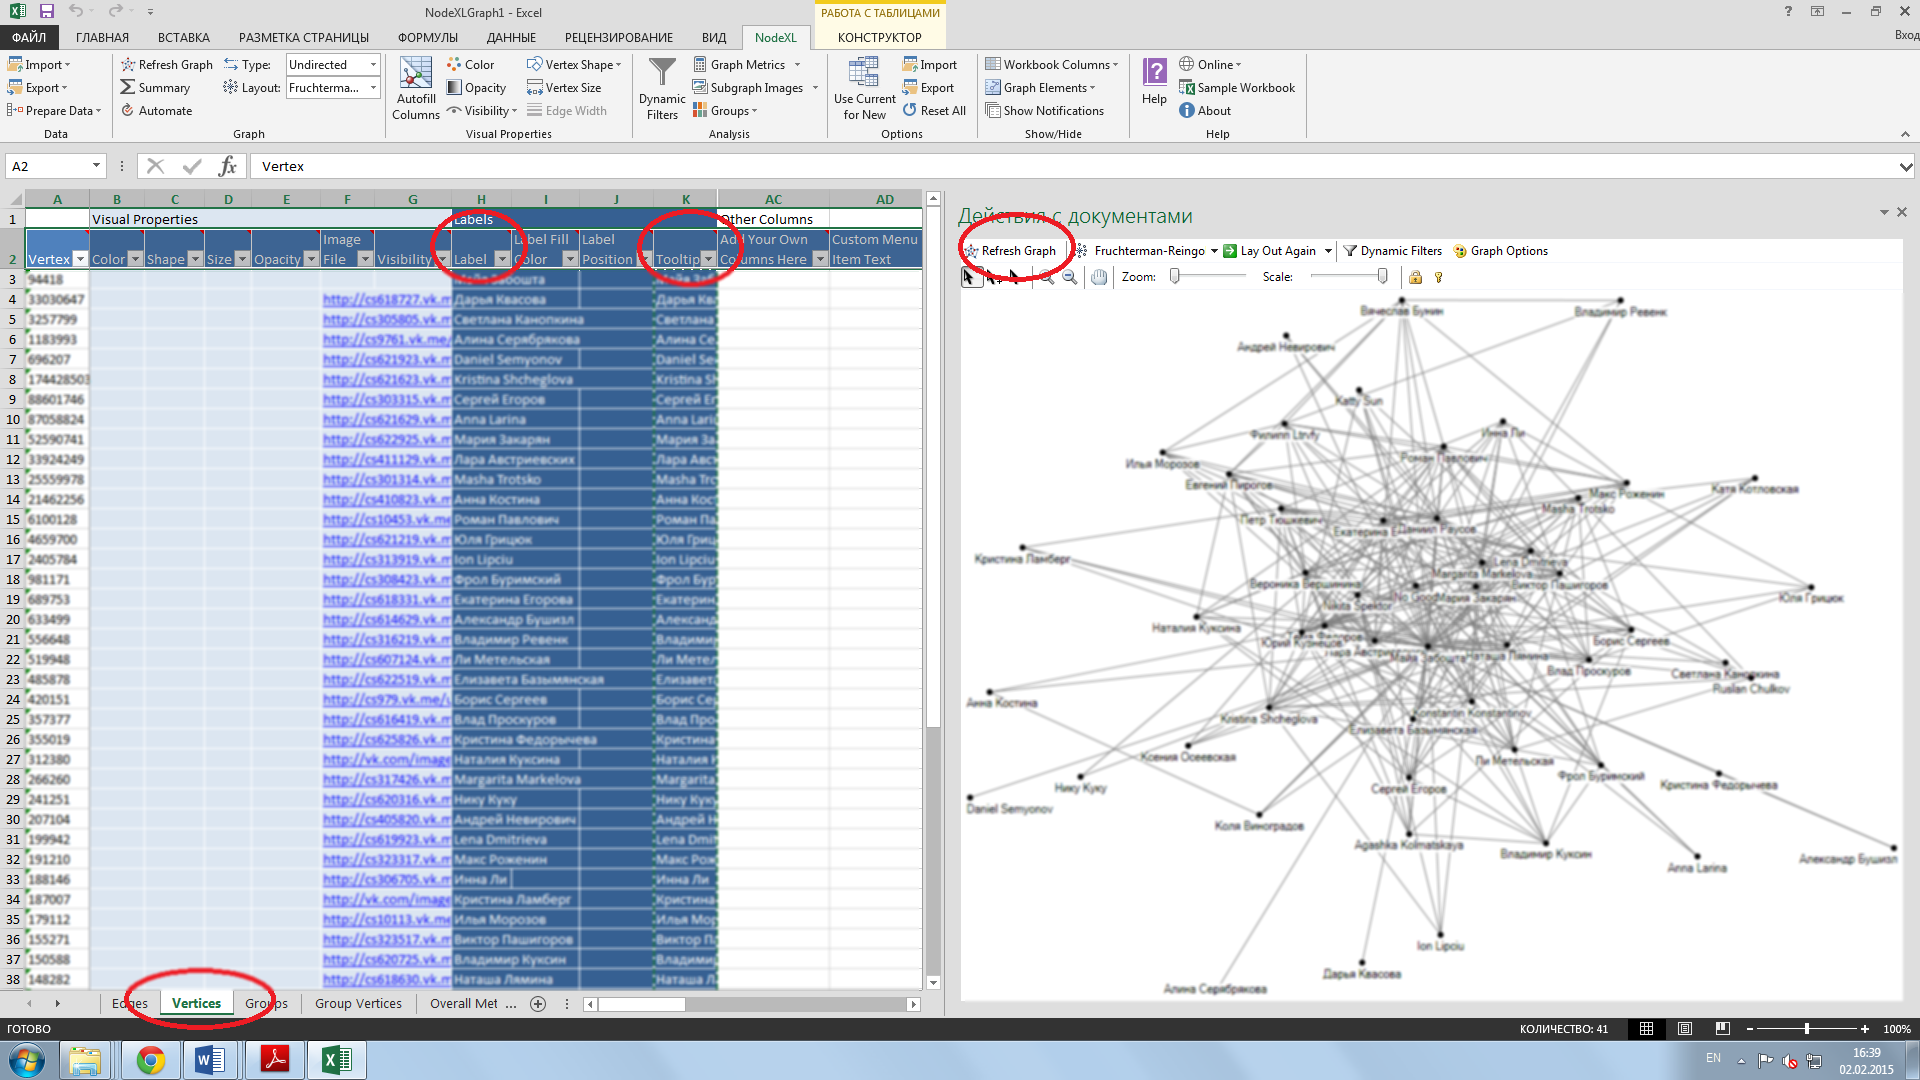
6.1. To name the nodes with the names from the VK accounts go to the Vertices worksheet and copy the data from Tooltip to Label. Then clique on Refresh Graph.
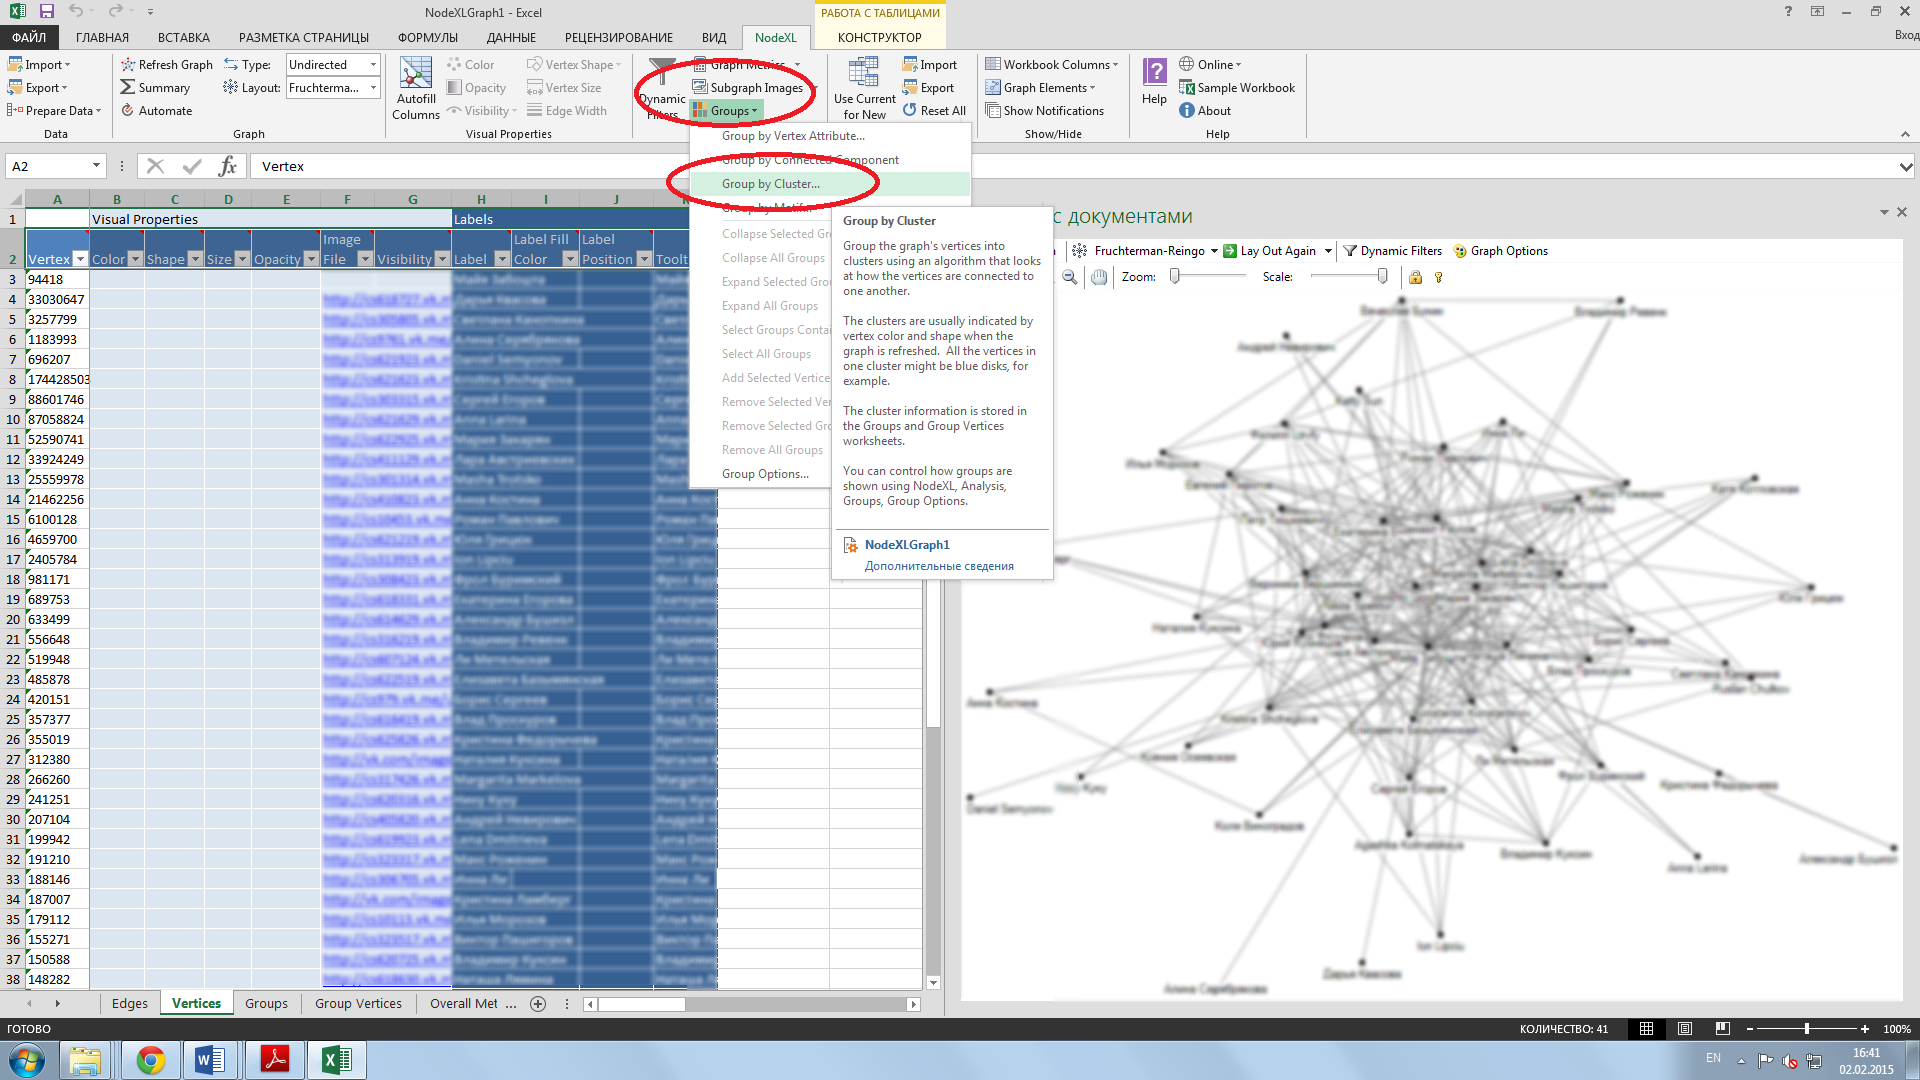
6.2. At the top find Groups – choose Groups by cluster – Ok. Refresh Graph.
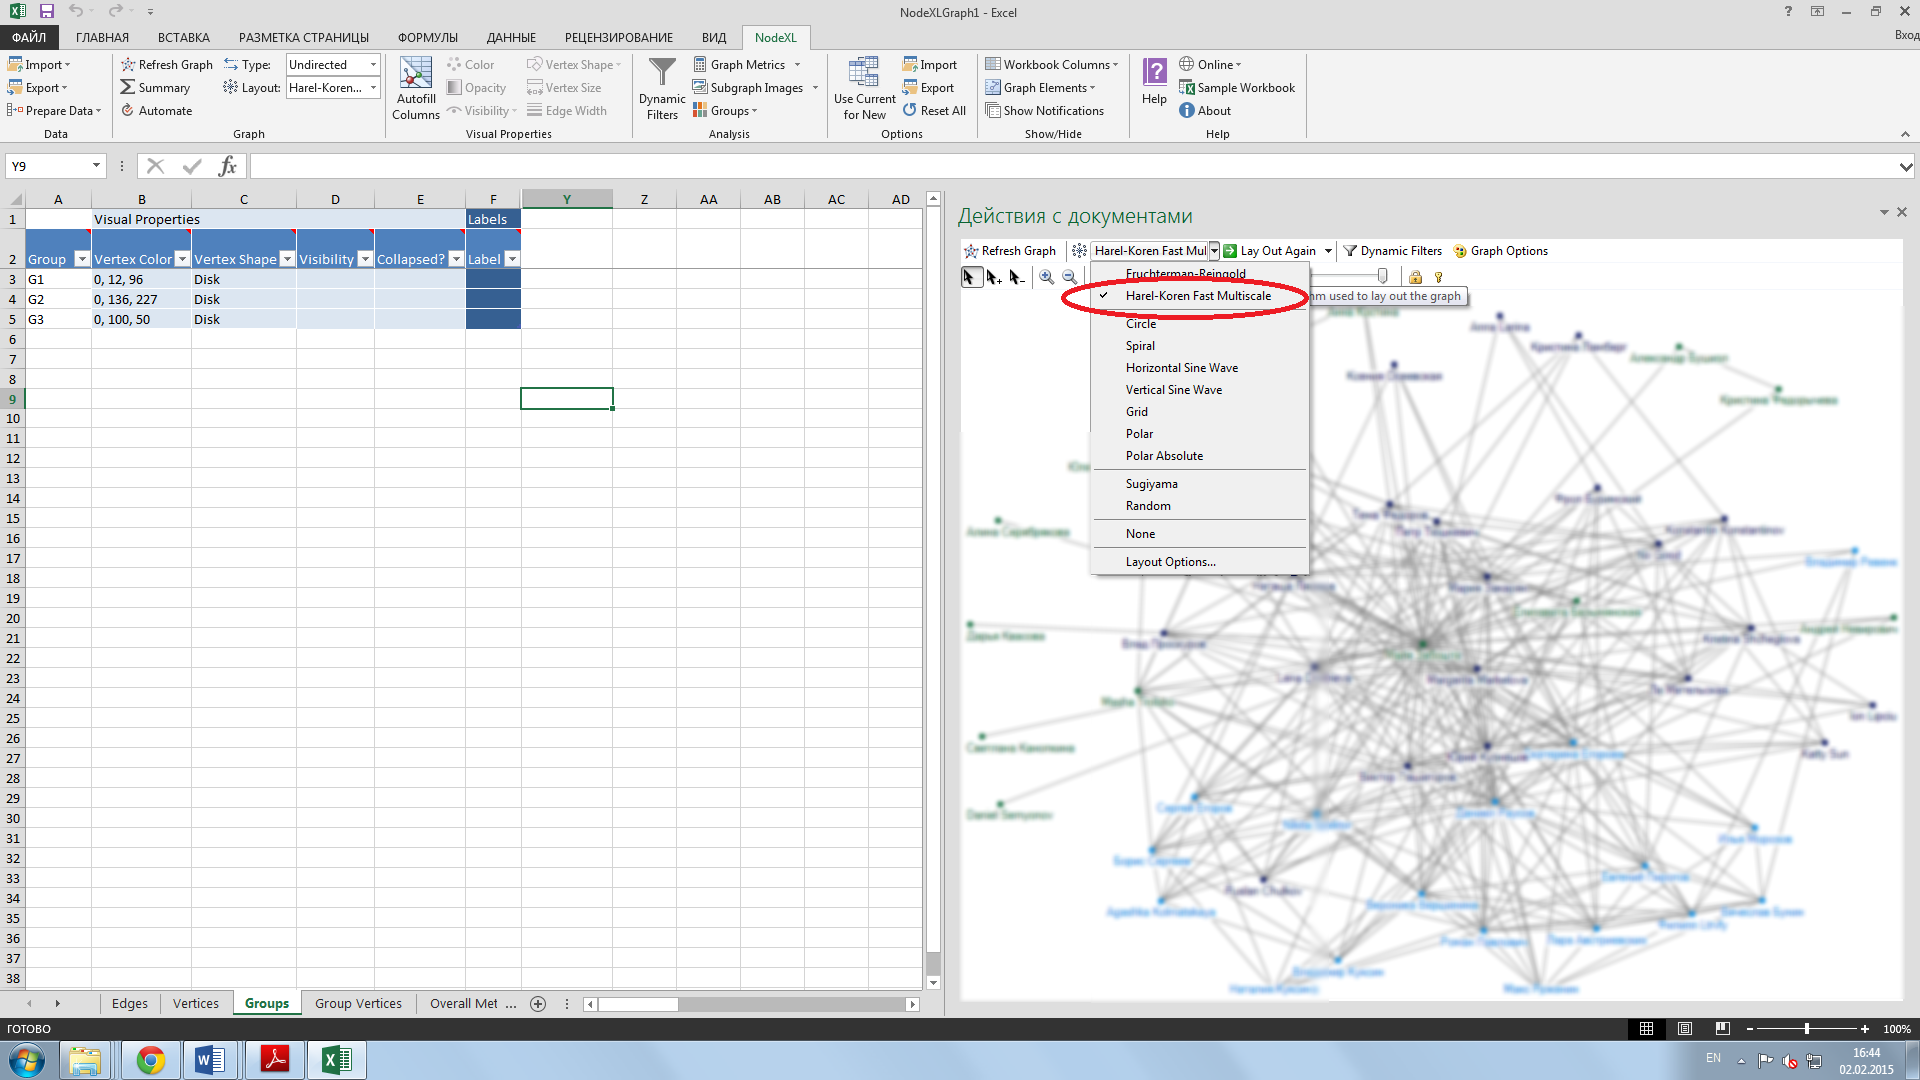
6.3. Now go to the visualization panel and choose Harel-Koren Fast Multiscale algorithm
Now you see the clusters of users by different colors created on the basis of the connections among nodes or different centrality criteria.
6.3. Save Image to File.
6.4. Export data with menu Export – Export to GraphML file.
